

Updated July 28, 2020
Welcome to our guide for building a business analytics program at your company. We’ve compiled this guide using our experience with customer projects, and development of our own analytics software. It includes a healthy mix of strategic and technical advice; as well as additional reading recommendations.
We focused on three things while creating this guide:
General education around core business analytics concepts
Describing technical aspects in a business-oriented way
Recommendations for what you can do right now to get started
Table of Contents
A little bit about who we are…
ReconInsight is a business analytics software and services company. Our mission is to provide the software, services and education you will need to achieve success in your business analytics program. If you have time and want to read more about who we are, we recommend this letter from our founders and our code of excellence.
Disclaimer: The majority of this is objective advice for starting a business analytics program, however, we do mention our own business analytics software, Ri360, from time to time. Just letting you know up front.
#1 Research and set expectations.
This may seem obvious, but we prefer to err on the side of caution. It is not uncommon for a business to set-up an analytics program only to be discouraged after a few days/weeks/months when they aren’t seeing any results.
It is important to be committed and intentional when investing in an analytics program. Business analytics is a new business function that will require planning, maintenance, and an investment of time, resources, and money to be a successful part of any business.
Since you are reading this post, congrats - you are already on your way to tackling this step! Think of this guide as a starting point for ‘things to research further’ and you will already be well on your way to success. Check out our blog for our latest business analytics advice.
Here are three quick ways you can level-set your expectations right now:
Decide how much time, money, and resources you are willing to invest to start
Create a broad timeline for your research and goal setting phase to ensure things keep moving forward (see #10)
Identify your team early on (see #5 & #6)
A successful business analytics program has the potential to provide exponential value over time and will influence your business in a comparable way that personal computers affected companies in the 80s and 90s.
#2 Data analytics vs. business analytics - know the difference.
The term ‘data analytics’ refers to TECHNICAL efforts such as cleaning, processing and presenting data; and ‘business analytics’ describes analysis that results in FUNCTIONAL, process-oriented change for the business.
What is data analytics?
Business definition:
For the end-user of a data analytics solution, ‘data analytics’ is viewed as the reporting and visualization of business information for human analysis to empower informed business decisions.
Technical definition:
A data analyst, however, would provide a technical description like this one on Wikipedia: Data analysis is a process of inspecting, cleansing, transforming and modeling data with the goal of discovering useful information, informing conclusions and supporting decision-making.
We will be addressing what it means to inspect, cleanse, transform, and model your data later in this post.
What is business analytics?
There’s a lot of great reading already in existence defining the difference between data analytics and business analytics, but the long and short of it is: business analytics is process-oriented, functional, and focused on effecting change at a company.
#3 Create a data culture.
Data is a mindset. It is a cultural shift away from ‘gut-feel’ business decisions to informed business decisions based on business analysis. In a recent report shared by Harvard Business Review, 99% of company executives say they are trying to move toward a data-driven culture, but only one-third report success.
When starting your business analytics journey, here are three things that will establish your business’s data culture:
Leadership buy-in - Leadership at your company must be prepared to dive head-first into their data. Decision makers and influencers must be properly educated, and invested in continued research and strategic planning.
Data democratization - Provide access to as many employees as possible. The days of analytics only being a ‘management thing’ are long gone. The best way to achieve business intelligence is to involve the entire business.
Change Management - Empower the right people and talent, train your employees to be ‘data literate’, etc.
To learn more about data culture, check out our post, “Building data culture at smaller businesses.”
#4 Plan on purchasing a data analytics visualization tool.
Let’s get this out of the way:

Don’t build it from scratch
Excel won’t be enough
The time it would take for an in-house resource to make a home-built analytics tool would cover any cost of analytics software. That being said, if you are already using excel or already built your own system - you are probably a couple of steps ahead of someone just starting out! You have already thought of how you want to use your business data and identified areas of importance for your business, that’s great.
The biggest value in purchasing a data analytics visualization tool vs. home-built platforms is the amount of time saved compiling your business data for analysis (aside from robust reporting and visualization features). Home-built platforms often require manual steps to compile your data from disparate sources prior to doing any analysis. We’ve seen company’s let their analytics investment go by the wayside because it is too time consuming.
A good data analytics platform should auto-update with your most recent data and be ready for analysis whenever you log-in. Save time, make data accessible, and you will be more willing to invest time in business analytics.
3 technical requirements for your data analytics visualization tool:
Addresses your data pipeline needs (see #6)
Addresses your need for clean data (see #7)
Flexible enough to present your data in a way that makes sense to your business user (see #8)
#5 Assign a business expert.
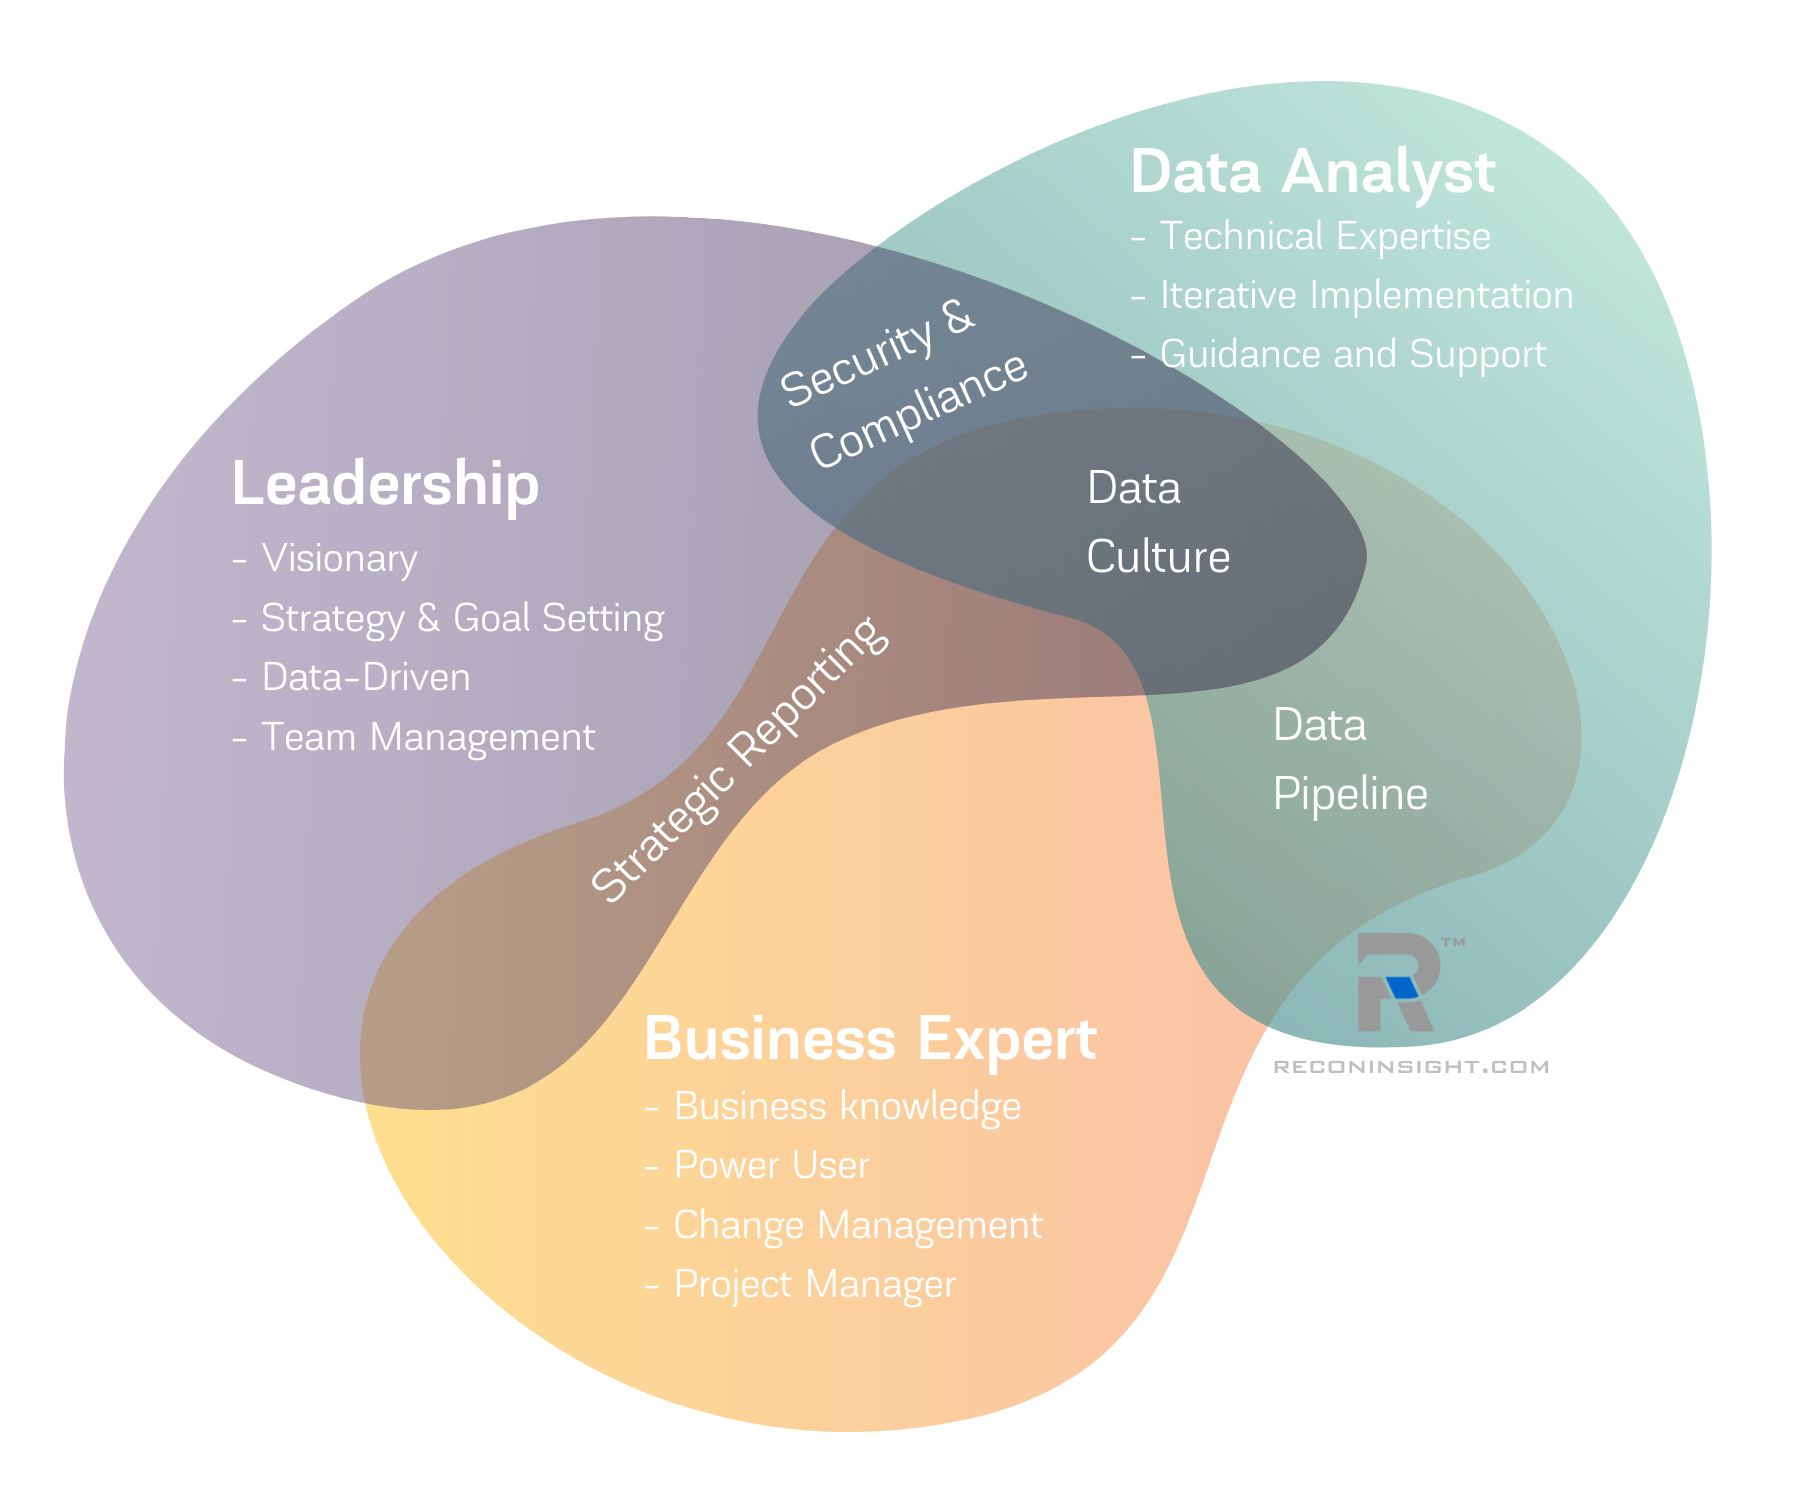
A business expert is a key member of any data analytics project and will work hand in hand with your data analyst (see #6). Business experts are essential for bridging the gap between your data and reports and identifying how your data should be presented and combined from disparate systems for your unique business needs. Business experts can also help with change management and establishing a data culture.
This should be someone at your company who is a creative problem solver and has in-depth domain knowledge. Domain knowledge may be understanding specific business processes, rules, and systems; or departmental or industry knowledge.
Depending on the size of your business and/or complexity of your business analytics program, you may have one business expert or choose to have multiple business experts focused on different departments or business functions.
Why we recommend a business expert:
You should already have a business expert (or many) at your company.
Involving your own employees in building your business analytics program lays the foundation for your data culture.
#6 Invest in a data analyst.
Data analysts are technical experts. They are essential for a smooth implementation and are excellent assets for further data analytics education and guidance after implementation is complete.
We recommend including a data analyst as early as possible in your planning. They will help you:
Set-up your analytics platform, reporting and dashboards
Set-up and manage your data pipeline
Ensure you have clean, usable data
Your data analyst and business expert will rely heavily on each other during planning and implementation, operating as opposite sides of the same coin. The data analyst responsible for technical execution and recommendations; and the business expert aligning the business goals and strategies with technical implementation.
If you are just starting your data analytics journey, you may not have a qualified data analyst on staff, but don’t worry. You can make do with part-time or project-based data analyst services to start. Many data analytics platforms offer services at additional rates which can be a great starting point for finding a data analyst.
Ri360 includes data analyst services from our Data Masters in its monthly subscriptions and we also manage set-up for all of our customers.
#7 Know your data pipeline.
Your data pipeline is a very important, technical aspect of data analytics. If this is your first time hearing about it, we aren’t surprised. Data pipeline is an advanced concept that we believe is a necessity for a successful business analytics program. Business analytics programs that enable strategic, data-driven business decisions have well-developed data pipelines.

What is a data pipeline?
Business Definition
We like how Alex Bordei defined data pipelines as, “an ideal mix of software technologies that automate the management, analysis and visualization of data from multiple sources, making it available for strategic use” in his article, The Data Pipeline - Analytics at the Speed of Business.
Technical Definition
The data that feeds your business analytics program must be carefully farmed and cultivated from one or many data sources through your data pipeline. The data sources could be a database, a data file, or other electronic interfaces such as an API.
Data pipelines also address data translation and mapping, which normalizes the data into an information structure that can be consumed by reporting and visualization tools.
Here’s a visual breakdown of a business analytics data pipeline. Each component (data processing, data store, and user interface) is traditionally represented by different software.
At ReconInsight, we designed Ri360 to be your complete data pipeline. It includes data processing, data store, and the user interface.
We will continue to share some key aspects of the data pipeline over the next few points, but for an in-depth overview, read our blog post, “What is a data pipeline? Business Benefits and Technologies.”
#8 Importance of clean data.
Your reporting and analytics is only as good as the data that it uses. Imagine your reporting and analytics tools as a house built upon a foundation. The foundation has two ingredients: your data pipeline, and clean data. Without these the house will crumble.
Data cleansing occurs in the first part of the data pipeline, data processing (ETL). It ensures that each data value is accurately formatted for consistency and data type (i.e. date, time, text, number, currency). A few examples:
“Notes” field does not contain garbage characters
“Sales Price” field contains properly formatted currency numbers
“Purchase Date Time” contains a correct (and consistent) date-time value
What happens if your data isn’t clean?
There are two main side effects.
First, your data visualization tool may fail. Visualization tools depend on correctly formatted data.
Second, you could make bad decisions. Making bad decisions based on malformed data is worse than a data presentation tool failure because you are unaware of the issue. Let’s say your source data contains an extra column in the data file for some of the data records. This would cause column values to shift to the right. In this case multiple cells are empty, causing totals and counts to be incorrect - without you knowing it.
Implementing a data pipeline will address your data cleansing needs. Once the data is clean, you’ve cleared the way for presenting and analyzing your information.
#9 Present your data for business analysis.
This section is about the last part of the data pipeline: the user interface (a.k.a. reporting tool), and how best to use it for business analysis.
Be smart with how you consume your data. Most data visualization tools offer a multitude of stunning ways to present your business information, and it can be overwhelming figuring out which visualization is best.
We believe that effective business analysis is found in simplicity. Flashy visualizations are great for executive presentations and weekly meetings, but to achieve strategic, in-depth analysis that creates business growth, you must first get rid of the visual noise. Focus on the data. Analysis that leads to change (usually) doesn’t happen by looking at colorful graphs.
Especially if you are new to business analytics, start with the core methods of reporting and visualization and familiarize yourself with their uses and strengths. There are three fundamental ways we recommend viewing your information:
Tables and Detailed Views
Charts, such as pie chart, line, bar, and column
Maps
Any reporting and data visualization tool worth its salt should have these visualization options.
#10 Implement iteratively and stay agile.
Hopefully we’ve successfully emphasized the magnitude of adding this new, technology-heavy business function at your company, because now we want to throw another wrench in the mix: implementing business analytics using iterative, agile methodologies.
If you aren’t currently using agile methodologies in your business, here is a beginner’s guide to agile methodologies. Agile is something you can use in all facets of your business, but it is especially well-suited for business analytics projects. Agile’s reflective, business-oriented, iterative approach pairs perfectly with the fundamental goal of business analytics: intentional and ongoing data-driven business growth.
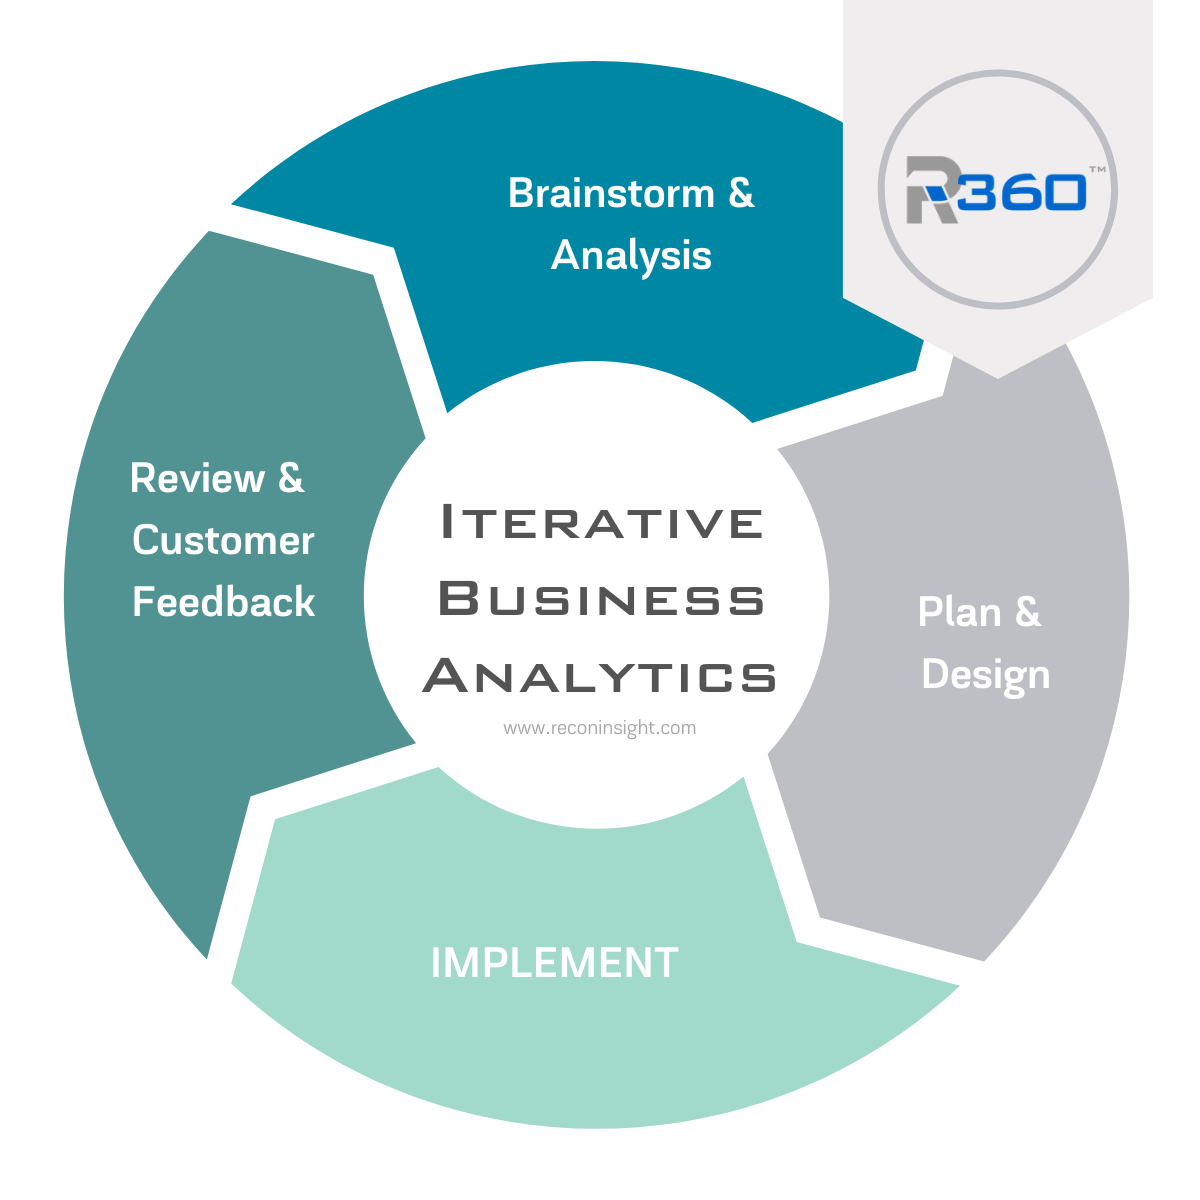
Our approach to agile data analytics implementations:
First Iteration:
Understand strategic goals (#11) that are set by leadership and business expert (#5)
Data analyst (#6) quickly implements a basic data pipeline (#7), allowing business data to flow from source through visualization.
At this point, the implementation is not complete but value is established and ready for the business expert to review and give feedback.
Second Iteration:
Business (leadership and business expert) provide feedback to the data analyst. Feedback may include:
Creating custom business logic between disparate systems
Reporting and dashboard requests
Data analyst implements request from the business.
This is an important step for the business. They are able to see their data for the first time and it allows them to contextualize all of their goal setting from concept to presentation.
Third Iteration and on
Feedback loop continues from the business’s requests to the data analyst implementation.
As the business becomes comfortable with their data and business analysis, requests to the data analyst become more specific and strategic.
Data analysts will also be able to provide recommendations from a technical standpoint that offer the business the best possible solution.
After initial set-up and review, we begin cycling rapidly through iterations. We recommend starting on strategic goals and ensuring you have ways to track and measure them. From there, move on to establishing ways to make business analytics an integral part of your company culture.
Longterm sustainability
In theory, these iterations continue indefinitely as you grow your business analytics program. The success of this methodology lives and breaths on assigning a business expert early on to drive your strategy and data culture, and investing in a data analyst to ensure you can implement requests quickly and easily. As you read our next couple of points, keep this agile methodology in mind.
If you still aren’t sold on the idea using agile methodologies for your business analytics program, TechTarget has a great definition for agile business intelligence you should check out.
#11 Define success with strategic goal setting.
Arguably the most important component to any successful project: strategic goal setting. Your business analytics goals should be specific, well-defined, quantitative, and provide value to your business. Goal setting is an indicator for how successful you choose to make your business analytics investment.
When should you set your business analytics goals?
Short answer: if you follow our recommendation of an iterative, agile approach, goals will constantly be created, changing, evolving, completed, and added.
Long answer: We recommend doing your first goal setting session after you have done your initial research, identified your business expert and data analyst, and have some reporting and visualization tools identified as potential solutions for your business.
Three steps to identify valuable business analytics goals:
Align your business strategy KPIs with your business analytics KPIs.
Don’t reinvent the wheel, use what you already have. Compile goals from your company strategy as well as department-specific goals (could be annual goals, monthly goals, longterm goals).
Identify business problems and work backward.
This will require objective and constructive reflection. A good place to start may be a round table with your executive team to share areas that they are struggling to achieve change or growth. Include your business expert and data analyst. White board ideas. Identify which business problems can be aligned with data points that are tracked in your company systems.
Stay lean. Don’t boil the ocean. Require objective prioritization based on effort and value.
After you’ve compiled a list of goals from step 1 and 2, categorize them by level of effort and the value they can provide. This will most likely be a joint effort of your data analyst defining level of effort and your business expert the value. Use this ranking as a baseline for which goals to prioritize first.
#12 Be prepared to spend time with your data.
After you’ve completed the implementation of your data pipeline and data analytics software, defined your first strategic goals, and your business analytics program is well underway: be prepared to continue spending time with your data.
Valuable business intelligence comes with time and continuous iterative exploration. Learn your analytics platform inside and out, explore your data, measure how you are performing against your goals, and identify new areas of improvement for future success.
Encourage your employees to start their day reviewing their dashboards, and have regularly scheduled meetings to evaluate business performance and take action.
Business analysis is a skill that can be learned, you just need to keep at it and take the time. Spending time with your data is the difference between having data analytics software and having a business analytics program.
#13 Stay open-minded and ready for change.
Successful business analytics programs effect change based on what they find. Every business is different, but here are a few guiding principles for staying open-minded with your analysis:
Put guesswork and ‘gut feel’ business decisions in the past. Turn to your data when evaluating the best path forward.
Identify areas of success within the business and make informed decisions to continue that success.
Stay objective when presented with data that shows a weakness or gap - don’t write it off as an anomaly or invalid because of x/y/z.
Use your data to find creative solutions for difficult problems.
Final Thoughts
We’ve just thrown a lot of information at you, so congratulations for making it to the end! We hope this guide encourages you to invest in a business analytics program at your company (or at least offers suggestions for where to start).


